How does the Speed Score work?
The Google PageSpeed Insights tool is a free tool that helps you identify areas of improvement for your website by bench marking the speed and optimisation of your website against other websites.
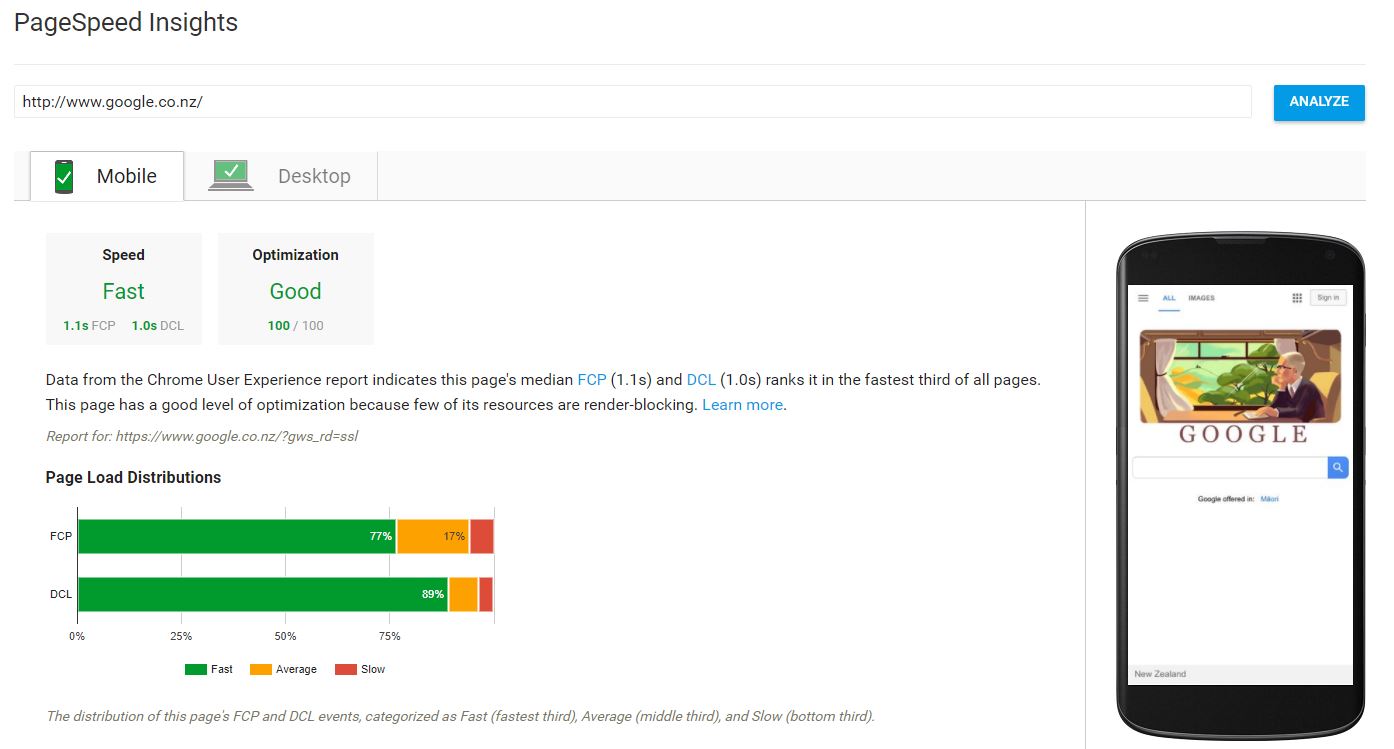
As of December 2017, w3schools report that 77% of people are using the Chrome browser. The Chrome browser contains a user report called the Chrome User Experience Report (CrUX) which uses data accumulated by your browsing history and the performance of the websites you visit (mainly loading performance) which is then sent to Google. The data helps Google improve PageSpeed Insights accuracy.
These are the elements of websites you are visiting that CrUX monitors:
- First Paint – rendering the first meaningful (visible) parts of your page to the user. Browser’s first stage of rendering.
- First Contentful Paint – the first images (including background images), text, SVG or CSS canvas have rendered. When users can start consuming content.
- DOMContentLoaded – the main HTML document has loaded (not waiting on CSS, Images etc). Important parts of the page have finished loading.
- onload – all page resources have finished loading.
After the data has been collected on how the website performs – your device, network and other variables are taken into account. These are the following dimensions:
- Effective Connection Type – your connection type/speed (slow-2g, 2g, 3g, 4g or offline).
- Device Type – phone, tablet or desktop.
Data is then formatted in a readable way and will give a result such as: 13.6% of page loads had first paint time measurement range of 1000-1200 ms when loading [website] on [device] over 4g connections.
This data is compared to all pages monitored by CrUX reports and then assigned a category.
- Fast – fastest 33% of websites
- Average – average 33% of websites
- Slow – slowest 33% of websites
What is the Optimisation Score?
After your performance has been determined, Google will evaluate the results and provide suggestions on areas where you can improve. These suggestions are based of the best practices for web development.
- Avoid landing page redirects – delays page rendering by telling crawlers to go to different URLs before loading the page content.
- Enable compression – HTTP requests can be compressed (e.g. with gzip) to reduce sizes and download times.
- Improve server response time – servers can slow your load time, avoid this warning by staying under 200ms.
- Leverage browser caching – used for recycling the resources pulled from servers, determining a caching policy reduces load time.
- Minify resources – remove unnecessary or redundant data from CSS, HTML and JS files.
- Optimize images – images can look the same but be saved at a much smaller size, you can also do this through vector images or sprites.
- Optimize CSS Delivery – browsers block rendering until the CSS has been loaded, make sure you don’t have unnecessary external stylesheets.
- Prioritize visible content – above the fold content should be prioritised and have a low data cost (ideally under 14.6kb compressed).
- Remove render-blocking JavaScript – before the page is rendered, the DOM tree must be built by parsing HTML. The more scripts, the more roadblocks which can slow loading.
Scores are calculated from 0 – 100 the areas where you can improve your website will be specified.
- Good – most of the best practices have been met, 80+.
- Medium – there are areas of improvements, 60 – 70.
- Low – there are a lot of areas of improvement, 0 – 59.
How can you use this to your advantage?
These insights are clear steps on how you can improve your website, fixing these issues can improve your SEO.


